The answer on page one
Scores for performance, efficiency, responsiveness and health, the key figures, and what to fix, ranked by what it saves. Savings that act on the same waste are counted once, never twice.
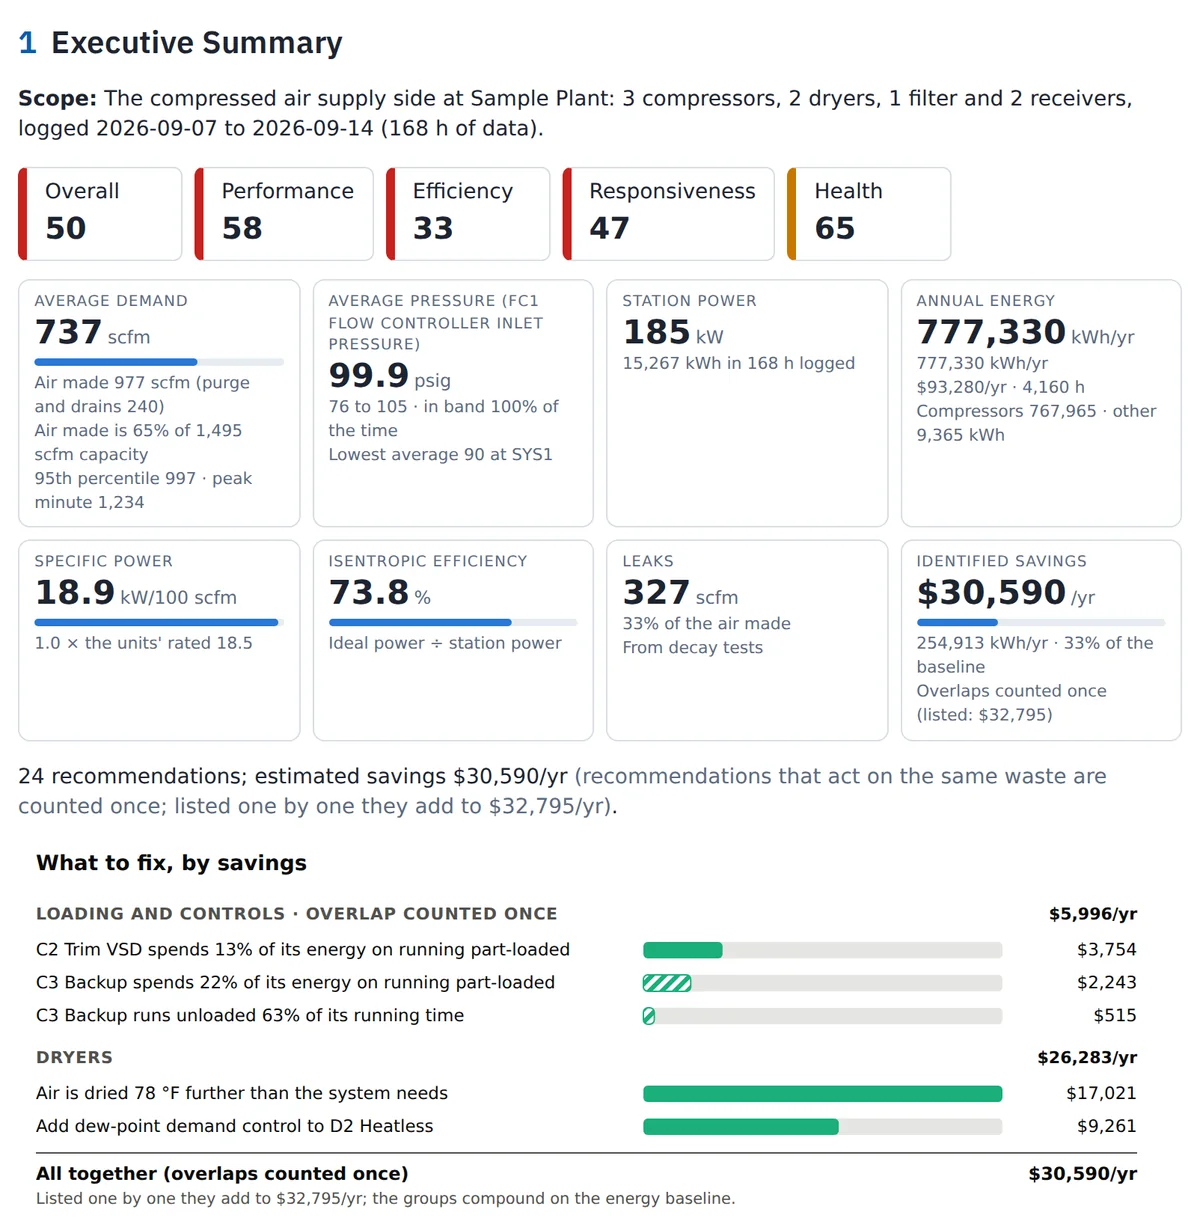

Pages from a real CAS ASSiST assessment of a week of logged data. Every number, check and chart below was worked out by CAS ASSiST from the logs and the equipment register.
The plant is Sample Plant, a simulated three-compressor plant built from patterns seen in real assessments. No customer data.
Scores for performance, efficiency, responsiveness and health, the key figures, and what to fix, ranked by what it saves. Savings that act on the same waste are counted once, never twice.
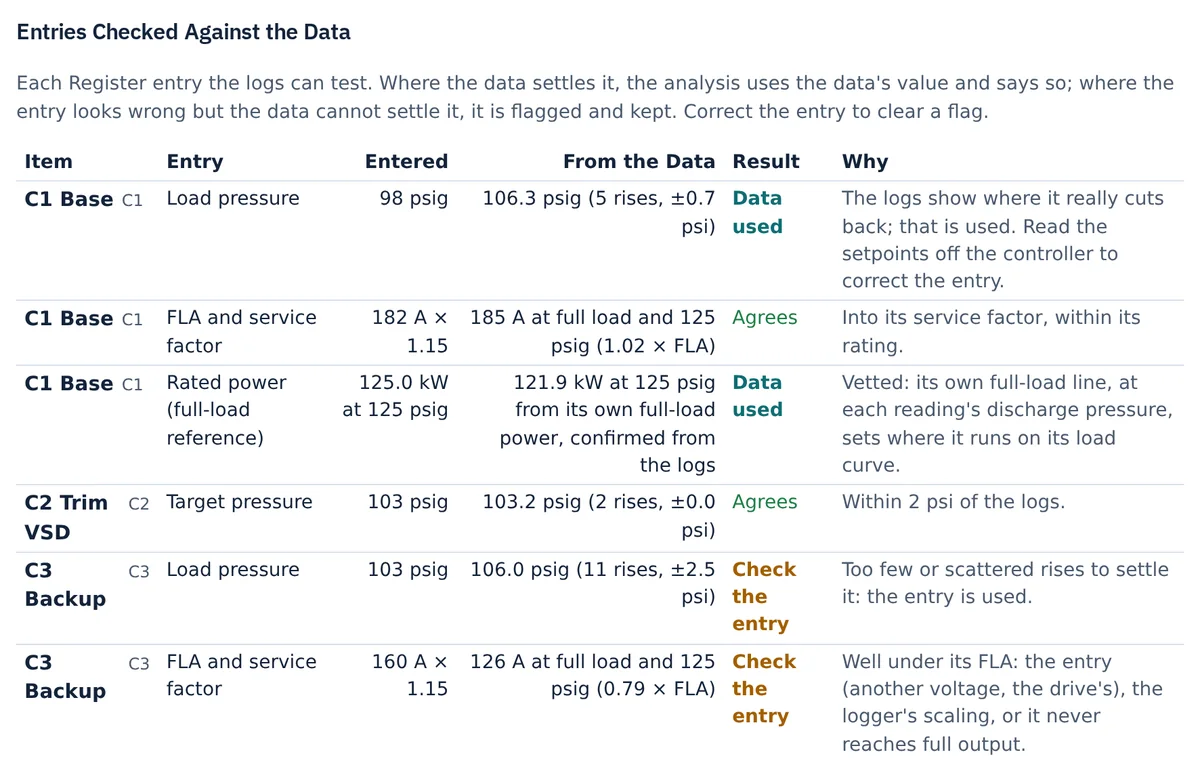
Setpoints, nameplate data and ratings are checked against what the equipment actually did. Entries the data contradicts are flagged, and where the data settles it, the measured value is used. Here a setpoint and a nameplate rating didn't match the logs.
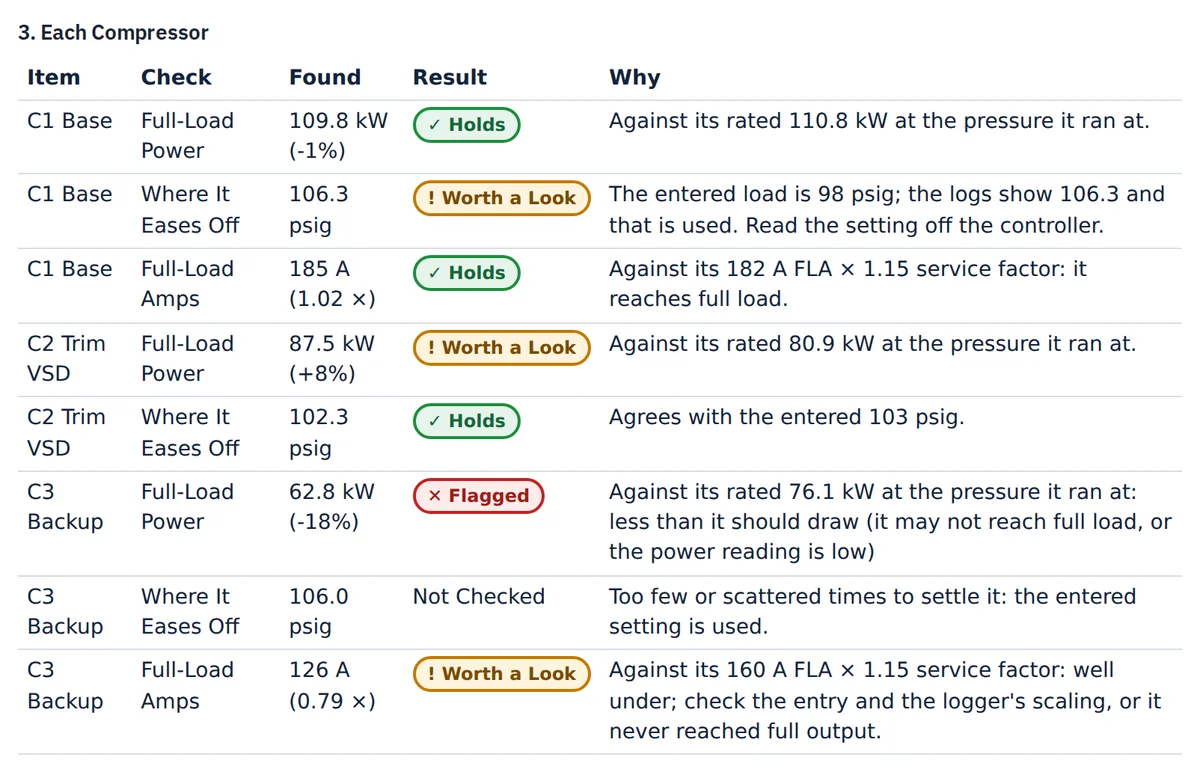
The system is worked out in order, each step building on what has already been confirmed, from the logged readings through to demand and leaks. Every result says whether it holds, is worth a look, or is flagged, and why.
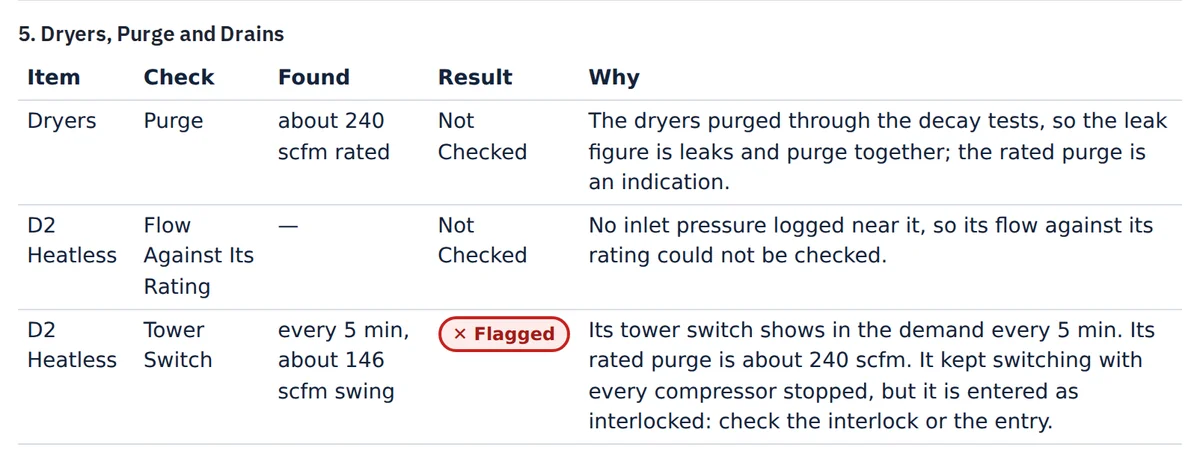
Problems that aren't in the equipment list still show up in the data. Here a dryer recorded as shutting down with the compressors kept running after they stopped, wasting stored air every shutdown.
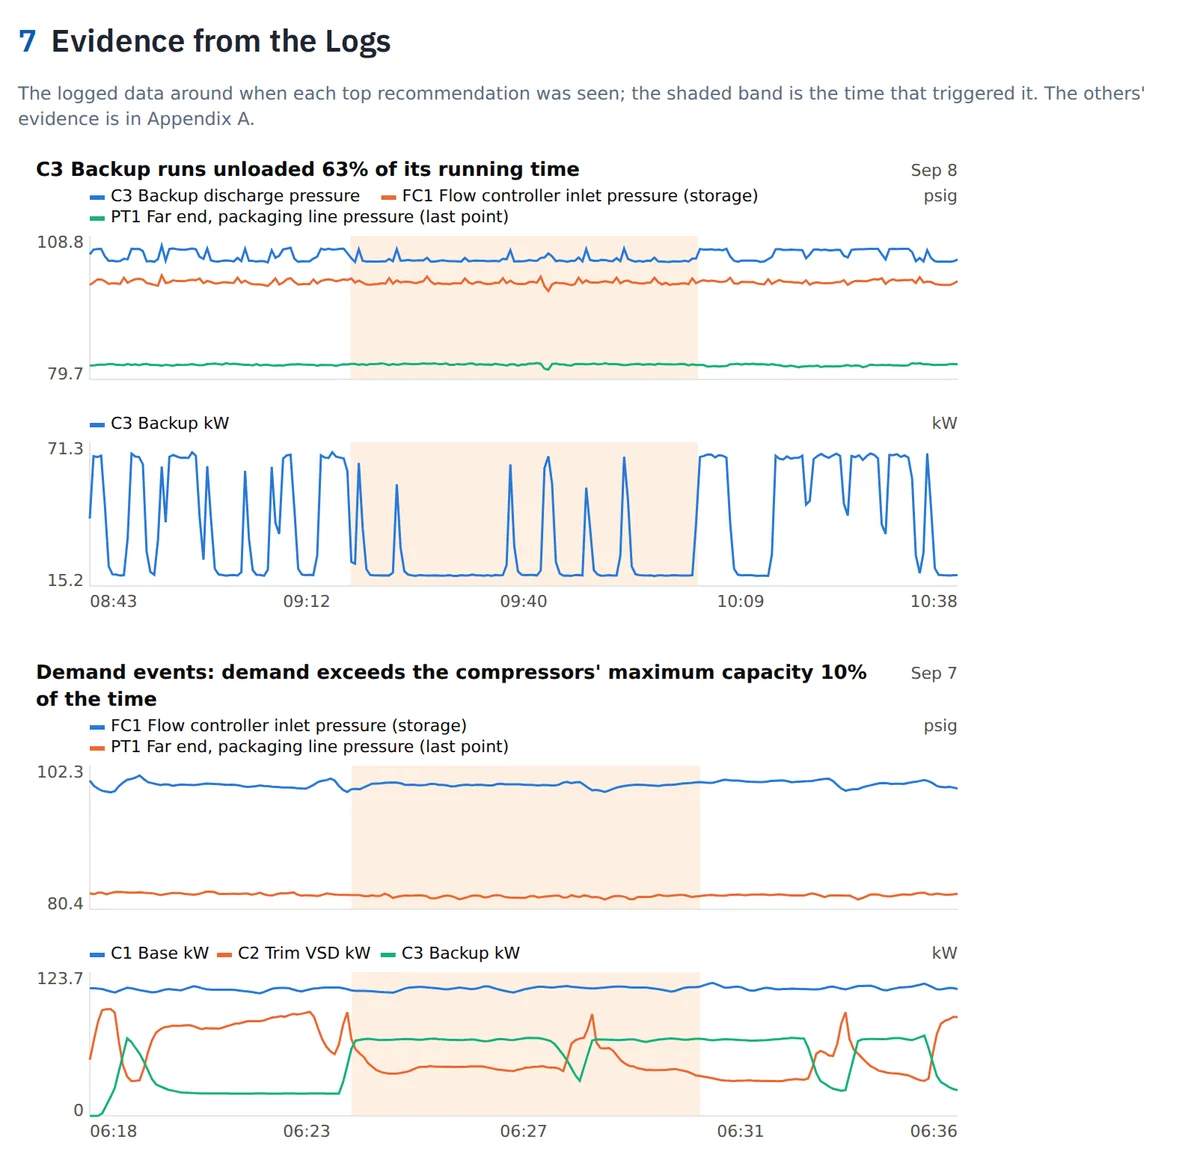
Every recommendation points back to the logged minutes that prove it, so you and your customer can see it for yourselves.
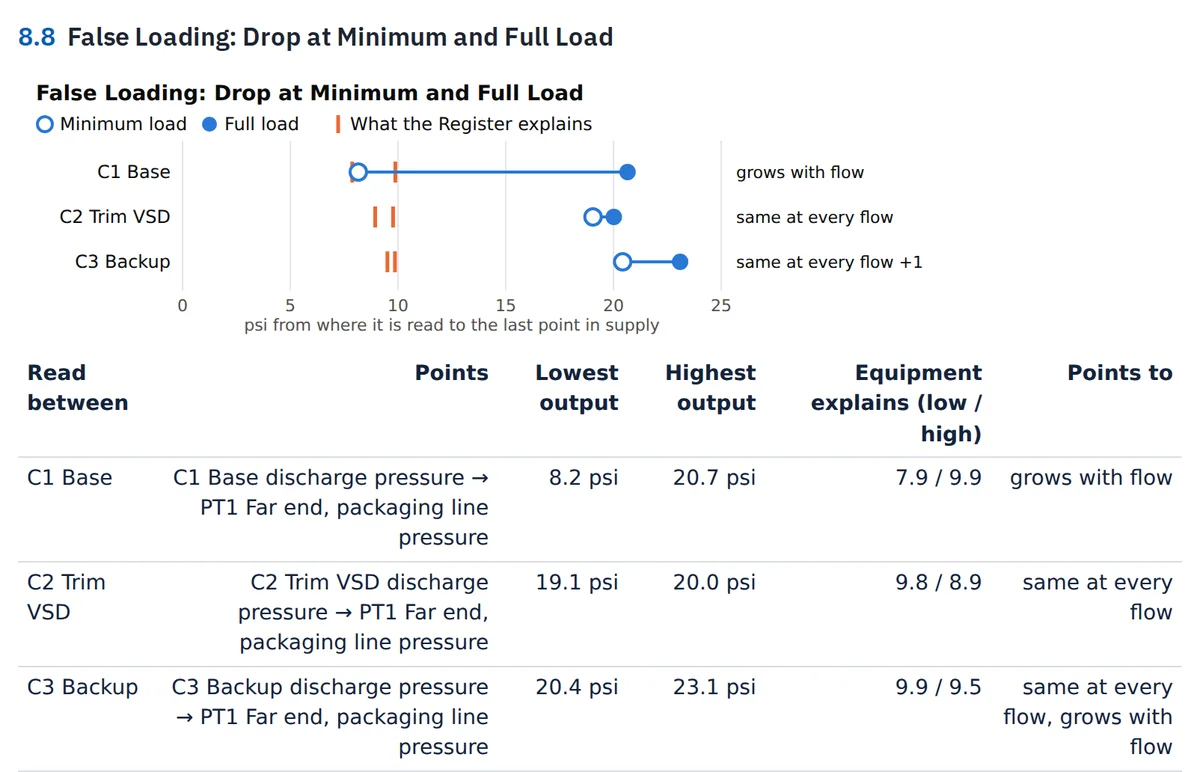
The pressure each compressor loses on the way to the far end of the system, against what the installed equipment should lose, and what the difference points to. Every psi made only to be lost is energy that delivers nothing.
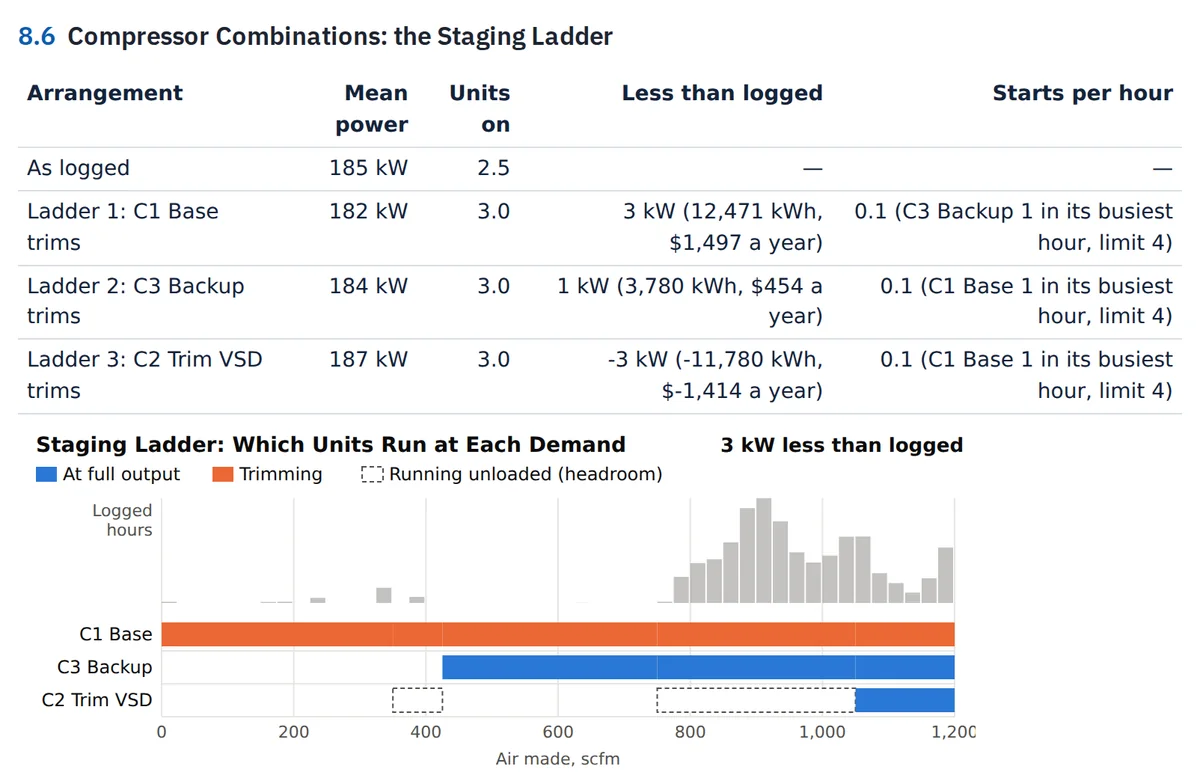
The arrangements of the compressors compared against the plant's real demand, with what each would save and what it asks of the machines.
See it on your own data.A guided demo on sample data, or on logs from one of your own sites.
Request a demo